At the highest level of reality galaxy clusters have developed out of a uniform density universe, dense cores of hot plasma gases and galaxies result from the hydrostatic counter pressures of gravitation and thermodynamic temperature with less intense and lower density surroundings that match up at their boundaries to other cluster cells with forces between them cancelled. The size and mass of each cell develop until each is representative of the universe, with averages of the density and temperature equal to the averages for the entire universe. Although their sizes vary with the total mass and numbers of galaxies varying over a fairly broad range, there is an average size of these structures that does not seem to have changed during the vast periods of time that it has taken light to travel from them to us.
Let’s consider how the following structures would pack together in filling up the universe. Our models will assume spherical shapes with all cells of approximately the same size. So how do they stack?
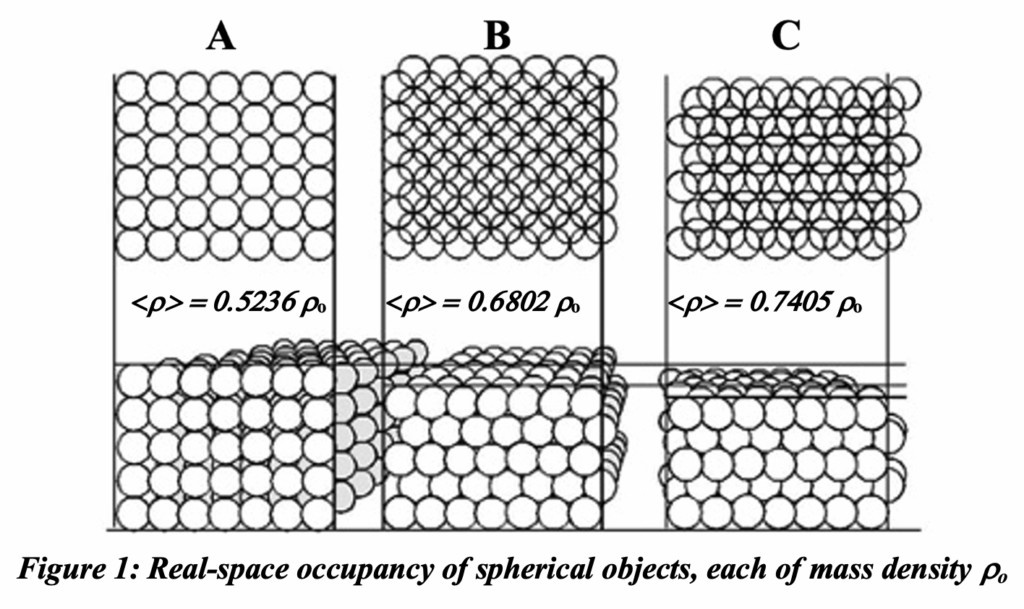
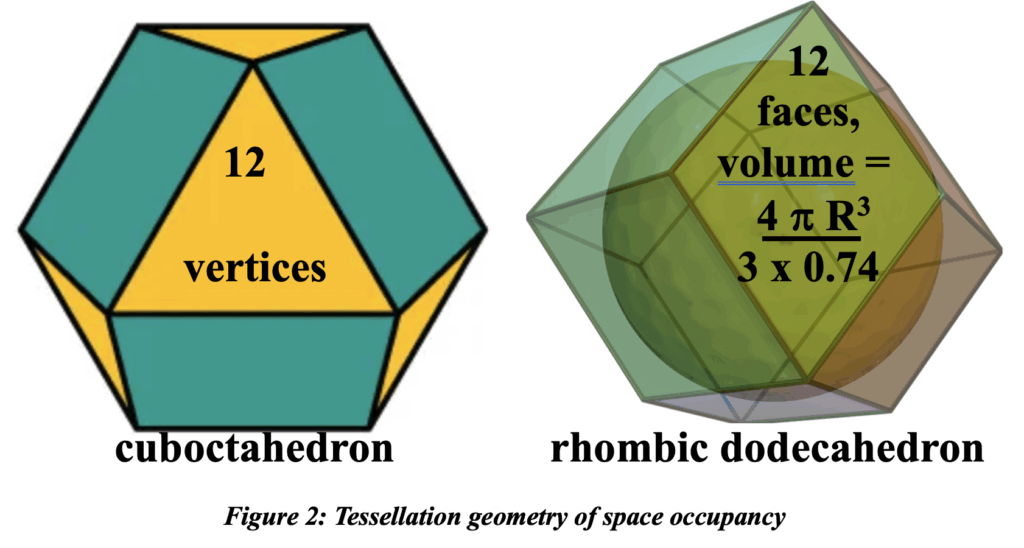
If the cells shown in figure 1 have a uniform density rhoo then with these packing schemes, the average density of space would be as shown. The maximal space occupancy of balls of a given dimension is as shown for option C. The relative position of the centers of the spheres is thus cuboctahedral in form; space occupied by each cell within this structure is rhombic dodecahedral with each face nullifying forces between cells. The average density of the latter is 0.7405 rhoo.
One doesn’t observe cluster cells; galaxies are what are observed. They reside primarily within the cluster cores. We assume option C above, with the ‘balls’ rigidly in place but transparent except for opaque centers (galaxy cluster cores) of radius R0, considerably less than R, the outer radius of the cells. The following table identifies symbols and parameters we will use in our analyses.
Looking through a virtually infinite space filled with these cells, to distances large with respect to R, how would the observed variations in the number of opaque centers with distance?
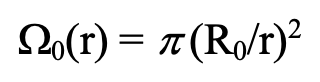
At a distance r, a core of radius R0 would subtends an angular area,
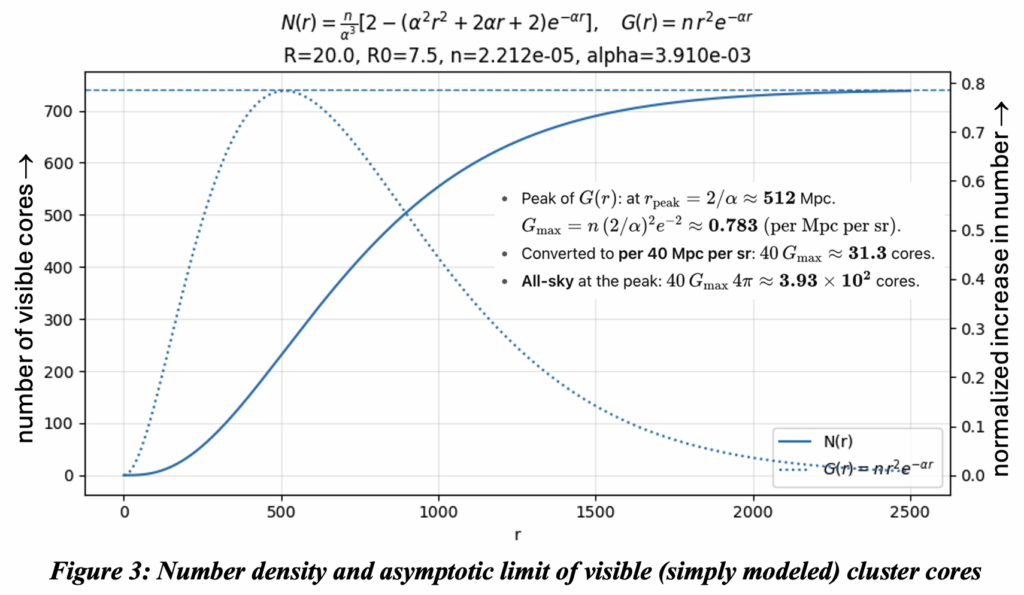
The number density of cores is n = 0.7405 / volume of rhombic dodecahedra, i.e., n = 0.177 / R3. In a thin shell at a distance r, the number of cores per unit solid angle is Nc dr = n r2 dr, but some of those will not be visible because of the probability that lines of sight will be obstructed by a closer core. The number of such obstructing cores is n p Ro2 r. Thus, the probability of a clear line of sight out to a distance r is e-a r and the total number of visible cores per unit solid angle out to the distance r is,

The final two expressions, which are independent of r, apply when r >> R. This is the limit of visible cores a distance at which the sky is virtually covered by intervening cores. See figure 3.
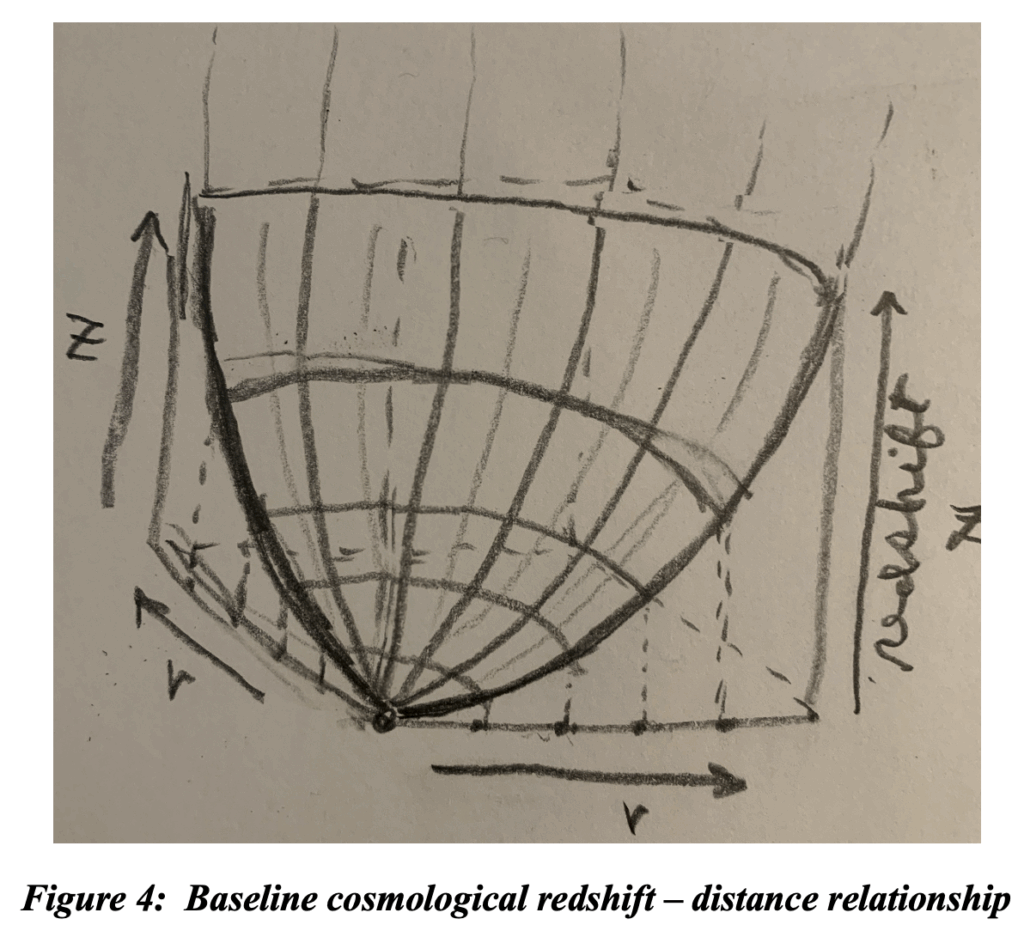
Admittedly one is left with no viable alternative to assessing distance as a function of redshift. Nonetheless, one must acknowledge that accepting a non-linear inference from spectroscopic data as cosmological distance has loosened our grip on reality. The options have been whittled down to choosing which of the possible mechanisms seems more reasonable as the cause of the observed redshift. Universal expansion of space in accordance with a LCDM model is currently in vogue. Out to appreciable distances this is nearly the mathematical equivalent of a uniformly dense plasma gas causing the redshift, and beyond those ‘distances’ the plasma model excels in comparison, without the acceleration/deceleration machinations required by the LCDM model.
Cluster cores are not opaque, but they are populated by galaxies that are their only visible (as in the visible spectrum) objects. At the center of cores there is a uniform x-ray spectrum with no obstruction to passage of other electromagnetic photons from objects beyond the cluster. This includes dark matter, which we don’t consider because it is the cause of an effect that does not need one. The dense hot plasma central to galaxy clusters induces the extreme observed redshift through cluster cores, producing the extreme redshift dispersion otherwise supposed to have been caused by additional invisible (non-baryonic) matter.
So, let’s (in a slightly refined model) assume that these smaller spheres (cluster cores) at the centers of the larger spheres are transparent with two exceptions: 1) they are filled with many, much smaller but opaque and highly visible particles (galaxies) and 2) the passage of photons through a cross sections of a core induces an increment that adds to the log of redshift D ln(z+1) of all objects that are occluded by the core. Now we will deal with redshift rather than distance.
Questions to be addressed are: 1) In this model, does the number of the observed galaxies appear as regularly spaced ripples in redshift? 2) If so, as it must, how does that periodicity vary with changes to the values of R and Ro? And 3) how is the distribution of luminosities in redshift affected by their actual widely varying distances? And what is the effect of these cores producing continuously decreasing rather than discrete increments to redshift? Other questions will arise as we refine our model.
Sky cover is no longer a simple limiting issue – rather, it becomes an interestingly repeated issue. Thus, let’s suppose that a line of sight passing through a cluster core increases the log of redshift of the received light by a fixed amount delta-ln(z+1) rather than terminating the line of sight. Since for large values of r, we defer to redshift z as the metric, the numbers of observed galaxies at each redshift will increase linearly as N* k ln(z+1), where k is the number of repeated sky cover situations. What is the asymptotic total number of galaxies at each incremental redshift?
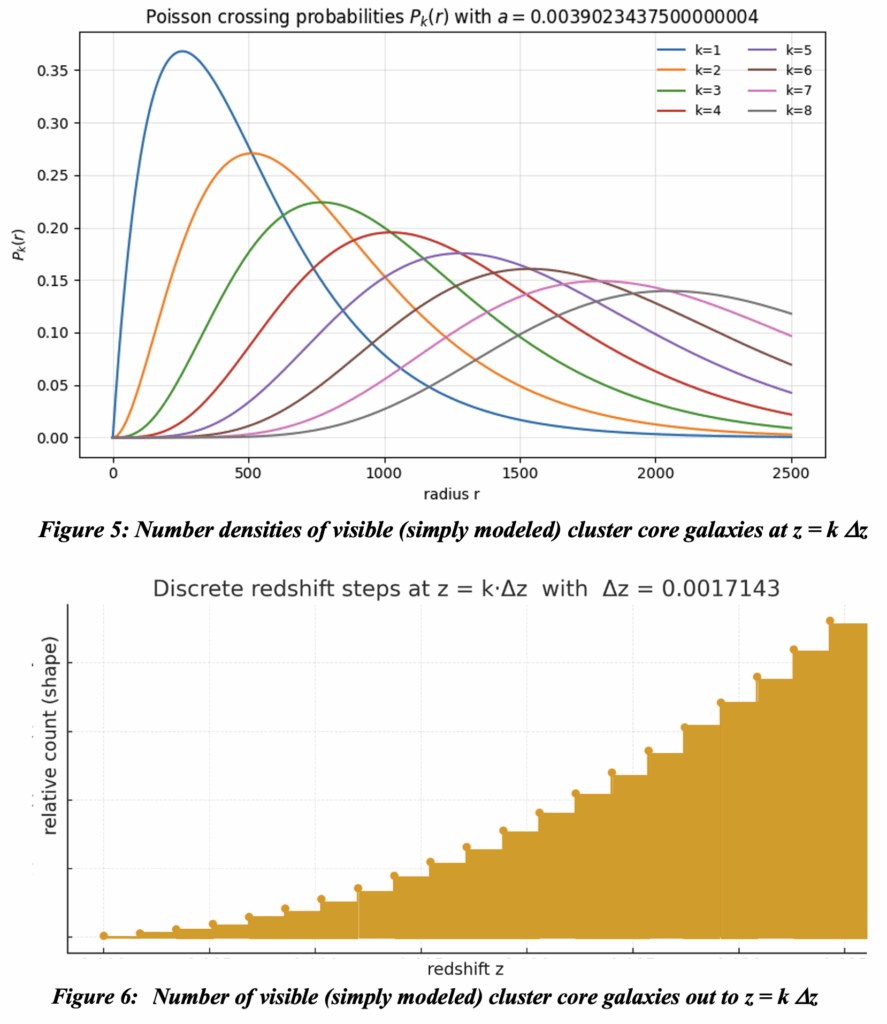
The total number of visible cores (and therefore galaxies) in each redshift band increases at roughly a quadratic level in k as follows:
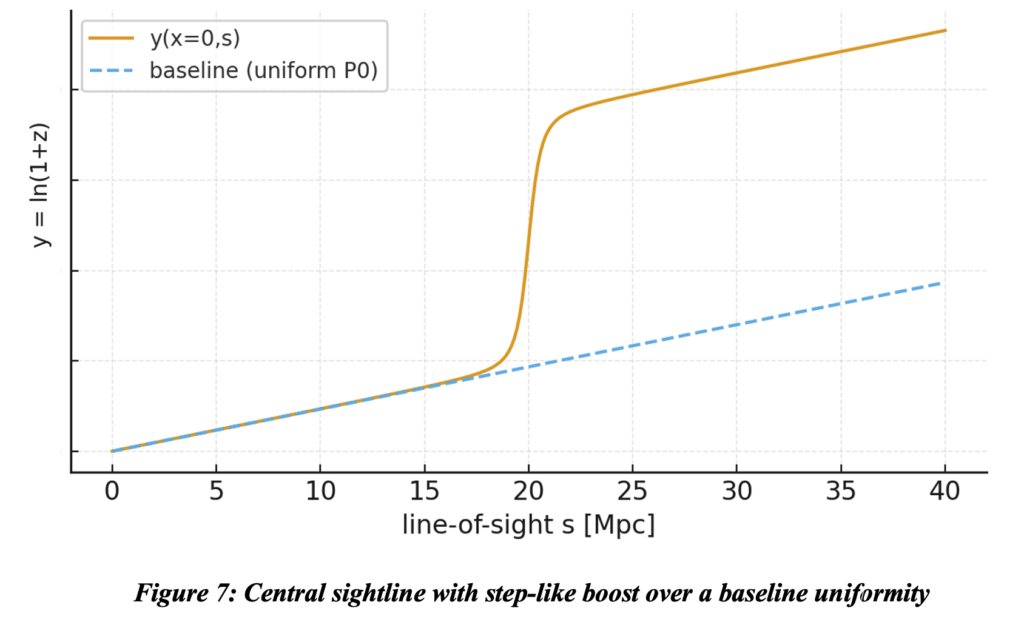
It is clear in the periodicity illustrated in the scatter diagram of Sparke and Gallagher’s chart presented in the previous post, that the numbers of high luminosity galaxies at each interval levels off. At large k values of redshift, extreme distance of large percentages of galaxies for a given redshift, as was shown in figures 3 and 5, significantly reduces their flux magnitude beneath telescope visibility.
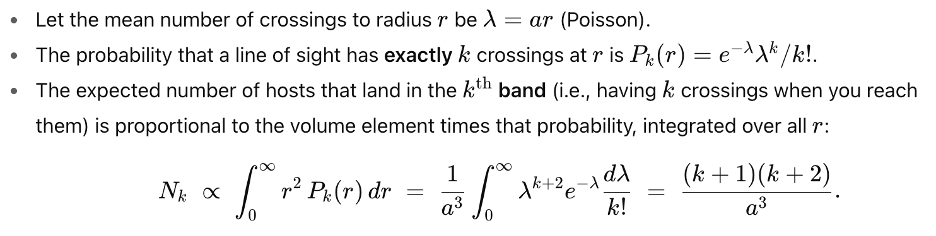
So figure 6 is clearly not characteristic of observations. The bands at incremental log-of-redshift, values, and therefore distance since r ~ ln(z+1), are not discrete. That is because we are counting numbers of galaxies and not just cores in which there are many galaxies at various locations throughout each core. So although the passing through a core adds an increment to the log of redshift that accumulates to ln(z+1), the galaxies within each core will be spread through the length of each core, giving a width to galaxy counts in each band. With the plasma scattering model the amount of redshift displacement of each galaxy is determined by the line integral of the line-of-sight segment from entering the cluster cell to the galaxy’s location within the core. If the pressure were uniform throughout the cluster other than the greater pressure within the core, redshift on a line of sight directly through the core would be as shown below
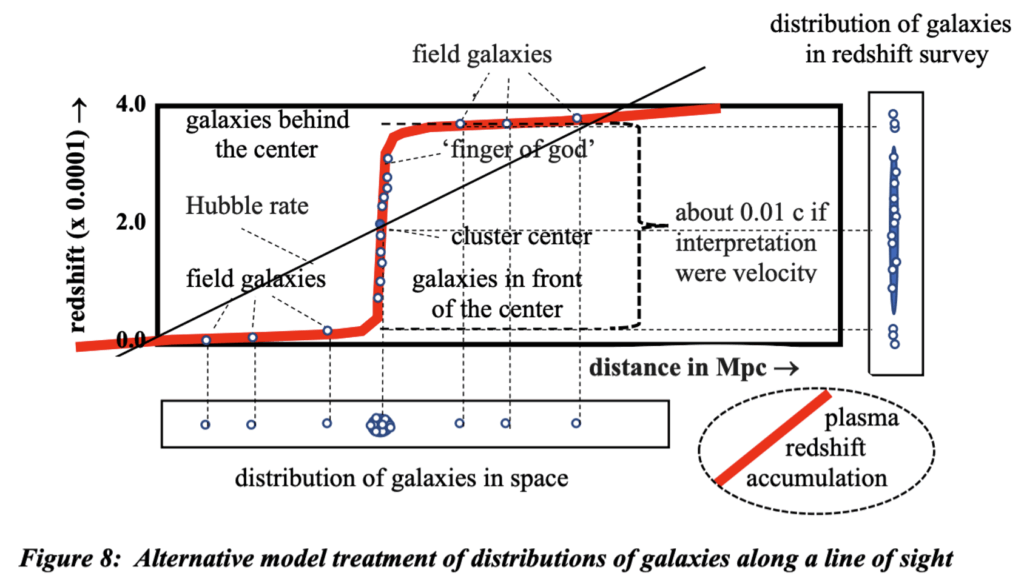
But the distribution of pressure throughout the cluster is highly concentrated in the cluster core as illustrated below with the associate effect on the redshift of lines of sight.
A distinguishing characteristic of the plasma model is that it doesn’t require unseen ‘dark matter’ to account for the extreme redshift dispersion through galaxy cluster cores. The baryonic matter in the more dense and extremely high temperature plasma gases in cluster cores contribute a vast majority of dispersion, the rest is due to the lesser virial Doppler of baryonic masses which does not contribute to cosmological redshift. Observed effects of these two mechanisms are different and it should be possible to implement tests to determine which is correct. The plasma effect is location dependent whereas virial effects are velocity dependent.
In nearby clusters such as Coma, it is possible to tie the individual galaxies to the cluster in spite of their vastly different redshifts. But in galaxy surveys out to greater distances, cluster associations are lost as can be inferred from figures 3 and 5.
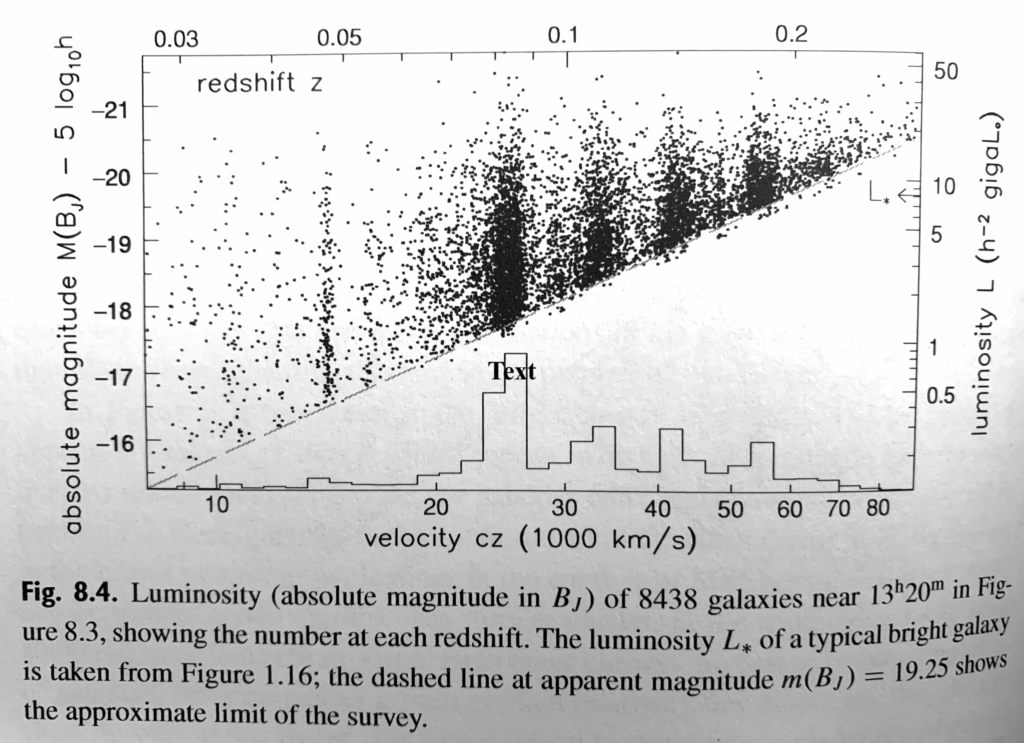
Figure 10: Sparke and Gallagher figure
Leave a Reply