It is the interactions mediated by photons of electromagnetic radiation in a thermodynamic system that maintains its equilibrium situation characterized by the Maxwell-Boltzmann distribution (MBD) for particulate matter and Planck distribution of photons. Prior to establishing equilibrium it is interaction between particles in the MBD and ‘intruder’ particles or photons that drive the system to a new equilibrium. These mediated processes are irreversible because the individual interactions are irreversible. They are the ultimate cause of entropy.
In this post we will address the environment of these interactions within an MBD, which is itself a distribution of particle ‘speeds’ since their velocities only appears as a square in the associated formula. These distributions will prove essential to quantifying the thermalization process and entropy rates. I will address those issues in later posts.
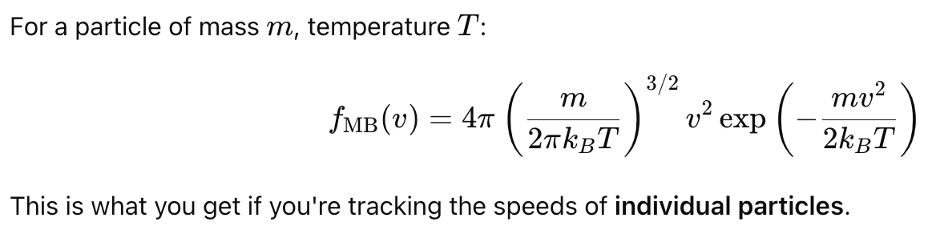
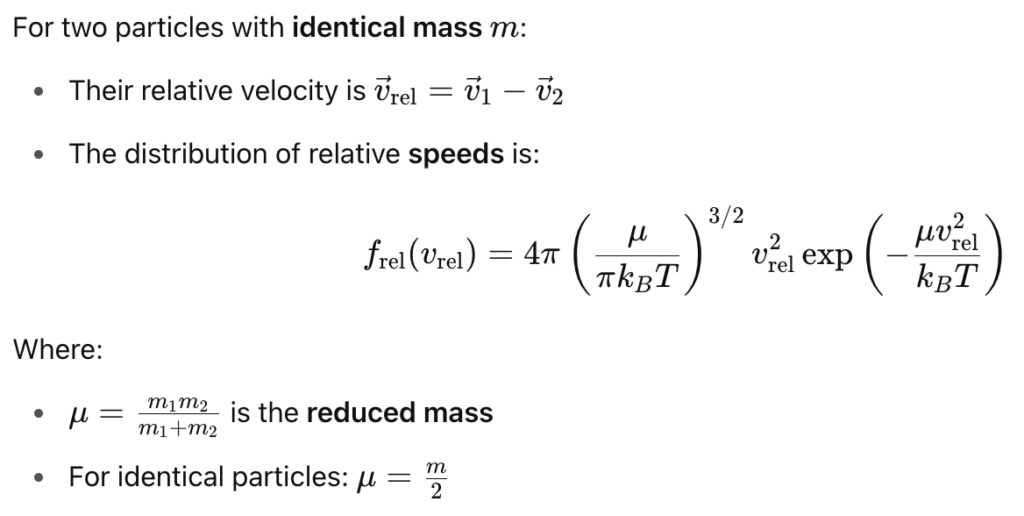
It is the distribution of speeds of the individual atoms relative to a laboratory or other fixed frame of reference. But interactions take place between particles for which it is their relative velocities that are of concern–in particular with regard to Doppler effects and whether the interaction is even possible as discussed in an earlier post.
These two distributions are shown in the figure below:
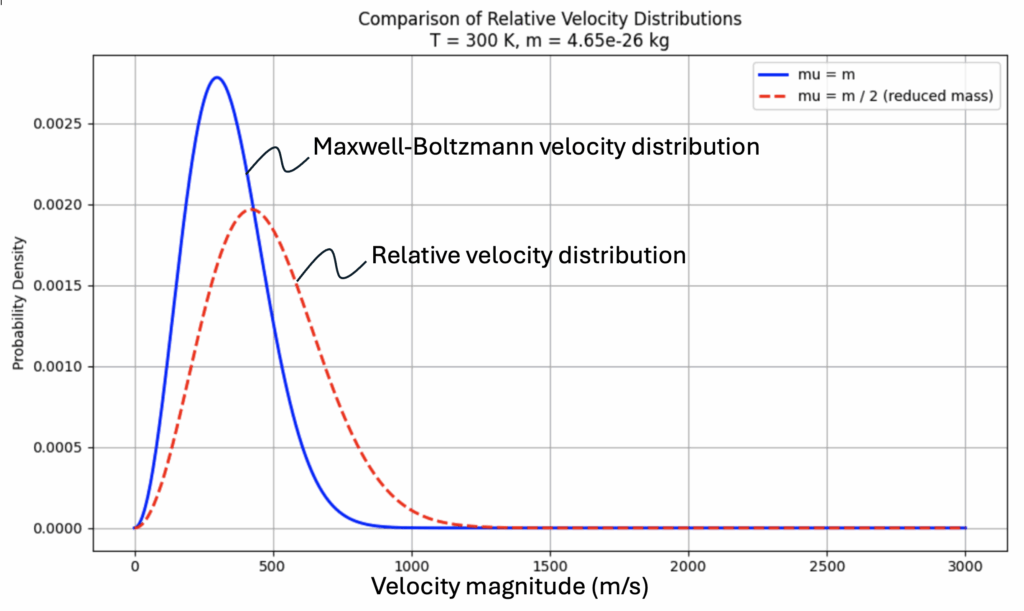
The blue curve is the MBD for a system of nitrogen atoms at a temperature of 300 K.
The red dashed curve pertains to the same system of particles but is the composite distribution of the relative velocities within the system.
This distribution looks very much like the MB distribution, but it:
- Falls off more slowly
- Peaks at a higher relative speed
- Is broader, because it’s effectively a convolution of two thermal velocity distributions
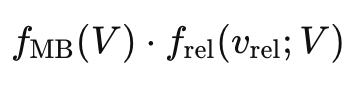
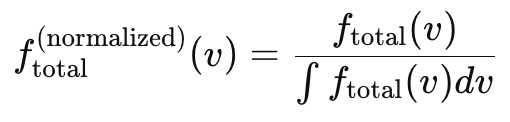
Next we consider the the distribution of particles with respect to a specific particle whose speed is V. There is a separate distribution for each and every V. The shape of the distribution function
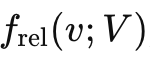
gives conditional probabilities — assuming a particle is moving at V, what’s the probability density for relative speeds of other particles within the system. We plot this for a series of velocities,
V = [0, 250, 500, 750, 1000, 1250, 1500, 1750, 2000, 2250, 2500, 2750, 3000, 3250, 3500] m/s
to obtain the following different distributions:
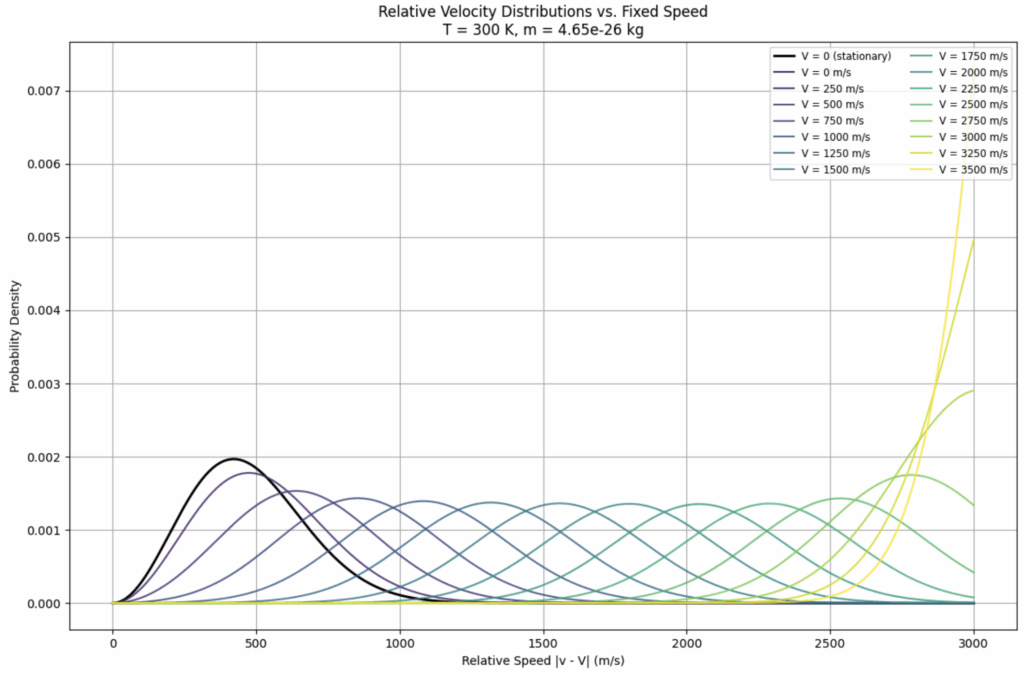
Each of these distributions applies to a single particle having the designated velocity V. It does not take into account the number of particles in the MBD that actually possess the velocity V. So it does not take into account the probability of a this distribution being realized.
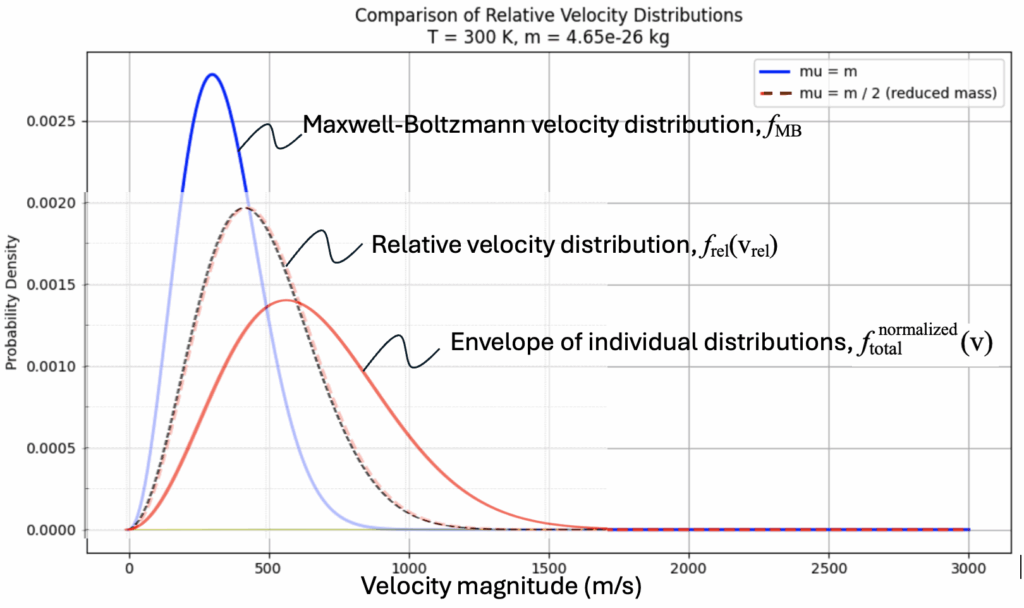
Once one takes into account the probability of there being a particle with velocity V into these individual distributions in the previous figure, one obtains very different distributions as shown in the following chart:
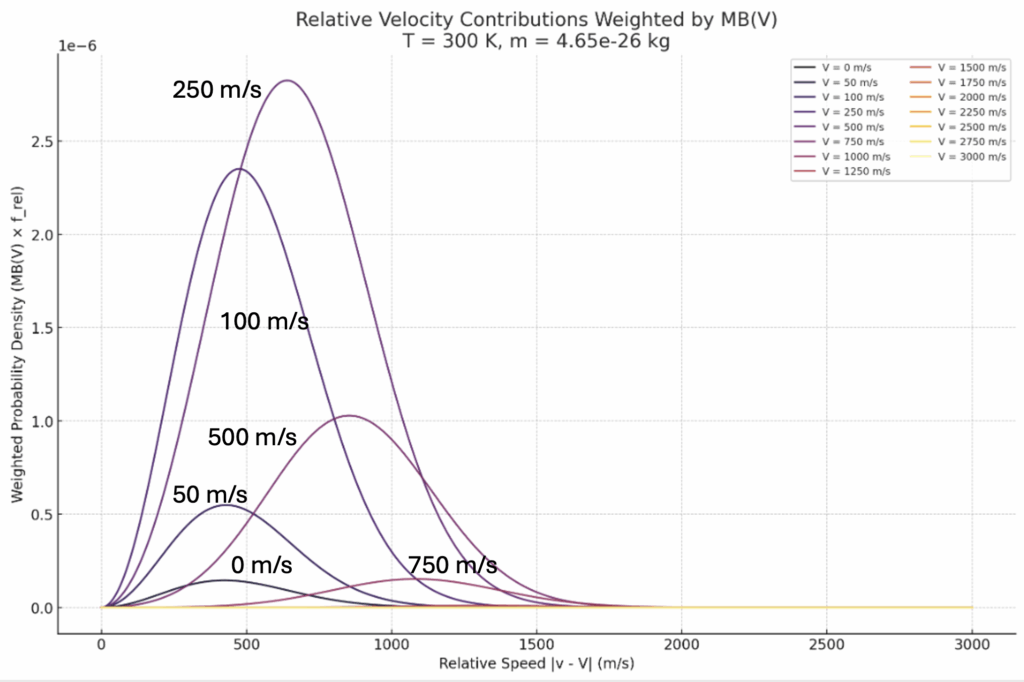
These could tend to look like a random assortment of distributions, but when a complete, equally-spaced, list is plotted it creates an envelope of curves as shown below:
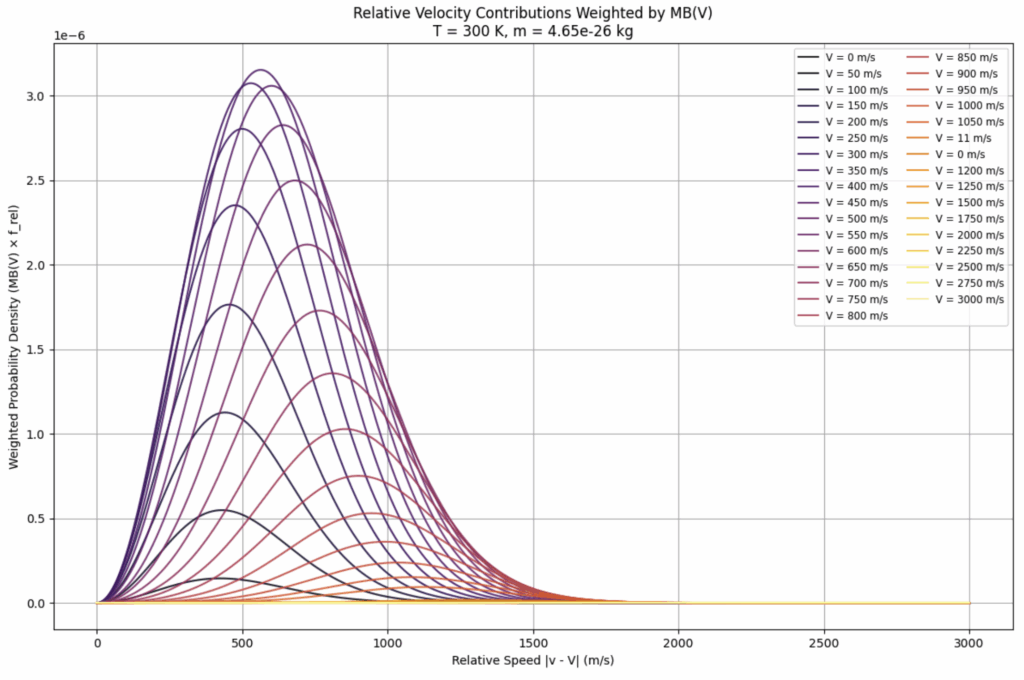
This shows the summing of many relative velocity distributions (each perhaps shifted to align with their peak):
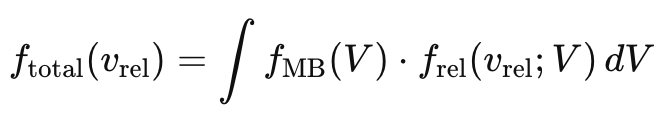
To obtain a normalized distribution to compare with the other distributions, we must perform the following normalization procedure to obtain the envelope shown in the next figure for comparison:
So we are left to ask: What is the most significant distribution of particle speeds to consider in a thermal medium.
Which is more relevant — MB, relative, or envelope distribution?
That depends on what you’re modeling:
| Situation | Most Relevant Distribution |
|---|---|
| Describing gas alone | Maxwell-Boltzmann |
| Collisions between gas particles | Relative velocity distribution |
| Effect of a single intruder on the gas | Relative distribution vs fixed V |
| Total interaction profile for all intruder speeds | Envelope (MB-weighted sum) |
All of them are important depending on whether we are interested in the description of a thermodynamic system, how it maintains its equilibrium, or how outside influences affect the system in thermalization processes.
Leave a Reply